Blog post
Blog Post
Boost Sales Productivity With Endpoint Monitoring
In this blog, we highlight how Catchpoint’s endpoint monitoring for Salesforce can help proactively identify and remediate performance slowdowns.
If Salesforce is slow, your sales team productivity is slow. Being able to look up opportunities and close deals is essential to getting business in the door. A downtime or a slow loading application can disrupt the sales process. Such a delay can result in revenue loss and increased toil as your operations teams are in constant firefight mode. Instead of getting inundated with help desk tickets from your sales team who are waiting for a page to load in order to close a deal – be proactive, get ahead of performance inhibitors, and help your team work as productively as possible.
In this blog, we highlight a real example of how Catchpoint’s endpoint monitoring for Salesforce can help proactively identify and remediate performance slowdowns before employee productivity is impacted, so you can get the most out of your investment.
Troubleshooting Salesforce
Endpoint monitoring provides visibility into all the different components that impact employee experience. Most of these components are outside the enterprise control, and when there is an incident, there is very little insight into what went wrong and where. Lets take the example of a real incident that impacted one of our customers to understand why endpoint monitoring is a necessity.
A Desktop Services Manager at a global software company relies on Catchpoint to monitor internal employee applications, including Salesforce. Recently, she noticed a drop in their employee user experience score which was trending positive earlier in the day.

The employee user experience score is based on calculations from network, device, and application performance data. The experience score helps shorten the time it takes to analyze data and get to the root cause of problems. Note the low experience scores (‘EXP Score’) for specific users and for Salesforce specifically, highlighted in red in the dashboard above (Fig 1).

Investigating the Salesforce ‘Exp Score’ further she saw a sharp decline in the overall ‘App Score’ being reported back by real users while a comparatively stable network score (Fig 2).
Salesforce is a complex SaaS service and there are a variety of parts of the system that could be slow. To investigate further, she has to find out the specific pages and functions that are experiencing issues before creating a ticket with Salesforce.
The data indicates that users are experiencing poor ‘Visually Complete’ times when accessing the opportunities page in Salesforce. The opportunitise page is critical to sales especially at the end of a quarter. Any issue with the page can disrupt the sales team so the sooner the issue is isolated and resolved, the sooner she can escalate and communicate it.
We can see the spike in visually complete time highlighted in the bottom right of the dashboard below.
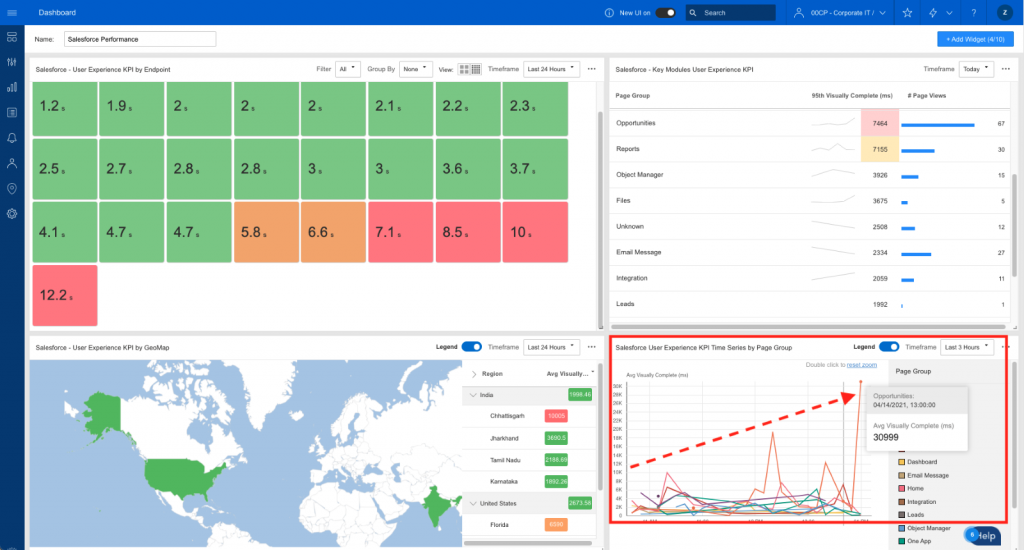
The concept of ‘Visually Complete’ is important to note here. In this specific incident, which happened at the end of the sales quarter, there were salespeople waiting thirty plus seconds just to view the page that they use to record important details and close business.
The Desktop Services Manager had no real insight into these types of performance issue mainly due to a lack of instrumentation within the third party SaaS environment. With the endpoint clients collecting data directly from real user’s devices, she can quickly analyze some critical components to figure out what is impacting performance.
In this scenario, she was interested in the basic HTTP timing components of each page that could potentially impact how fast resources needed to render the page are loaded. Read about these critical HTTP components here.

In Fig 4 we can see that the opportunities page is comparatively slower due to high ‘SSL’ times and ‘Wait’ times of 1+ seconds.
The next step, before raising a ticket with Salesforce, is to rule out any network issues that could cause high SSL or Wait times from the individual user’s network and local machines.
Reviewing the network path (Fig 5) from the user’s devices revealed no end-to-end packet loss or latency spikes from the user’s local network to Salesforce.

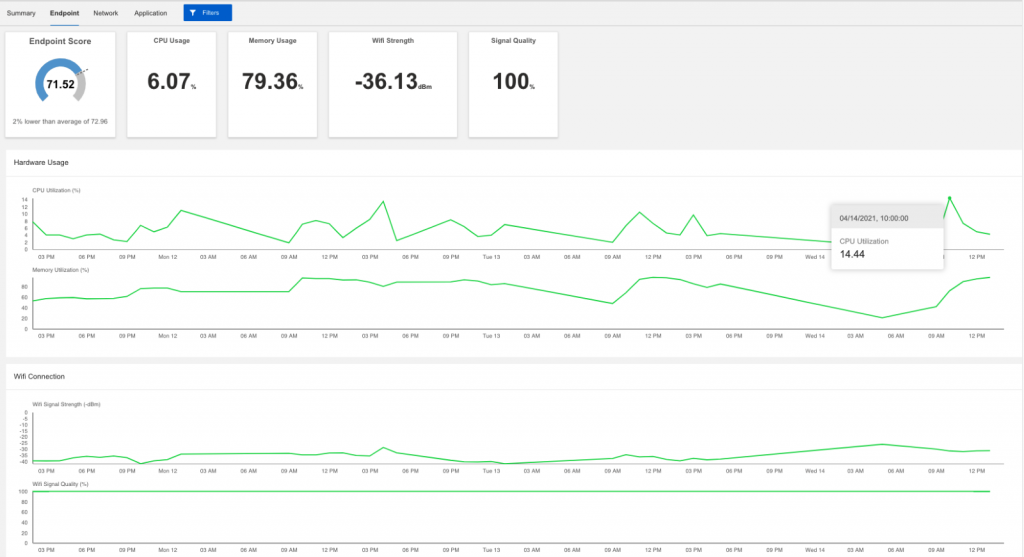
Checking the data from the user’s device ruled out the possiblilty that the user’s machine was experiencing abnormally high CPU or memory usage (Fig 6).
Better Visbility With Endpoint Monitoring
Endpoint monitoring makes it easy to identify and measure common problems that employees experience such as:
- Slow response times
- Application connectivity and interactivity
- High load times and other vital web application metrics
Having the data on hand to observe the end-to-end experience allowed the customer to properly share and communicate the performance issues to Salesforce for remediation.
This is just one example of how our customers use Catchpoint for monitoring Salesforce. We’ll highlight additional use cases in our upcoming posts.
How To Monitor Your Employee’s Salesforce Experience
So, where do you start? System administrators can gain complete vibility into Salesforce performance with the combination of both proactive/synthetic monitoring and local user endpoint monitoring.
To begin with, test Salesforce for availability and reachability using Catchpoint’s proactive synthetic monitoring capabilities. You can then build reports to track trends and changes. For example, you can create a report showing the overall availability and response times on a monthly, quarterly, and yearly basis.
If you want to see the “real” end-user experience, consider enabling real user monitoring (RUM). This can be especially useful when users are remote and reporting poor performance. You can quickly determine if the application, network, or device is causing the problem for that user.
- Synthetic monitoring ensures that the app is performing regardless of whether a user is using it.
- Endpoint monitoring gives you coverage wherever your users are.
- Enable RUM to complement performance analysis with real data.
Learn more about monitoring Salesforce with Catchpoint, download the ebook here.
This blog was Cowritten by Neelum Khan and Zach Henderson
April 15, 2021


Neelum Khan
This is some text inside of a div block.