Blog post
Blog Post
Post Incident Review: Comcast Outage
On Friday, June 29th 2018, Comcast experienced a major outage caused by two unrelated fiber cuts to their network backbone providers.
We get upset and frustrated when a site we are trying to access is unavailable. That frustration multiplies when we can’t reach any site on the internet. On Friday, June 29th, Comcast experienced a major outage caused by two unrelated fiber cuts to their network backbone providers. Media reports the outage began a little before 10 AM Pacific time. Comcast Cares Twitter account confirmed the outage around 11 AM. At 11:37 they indicated the outage was due to a fiber cut.
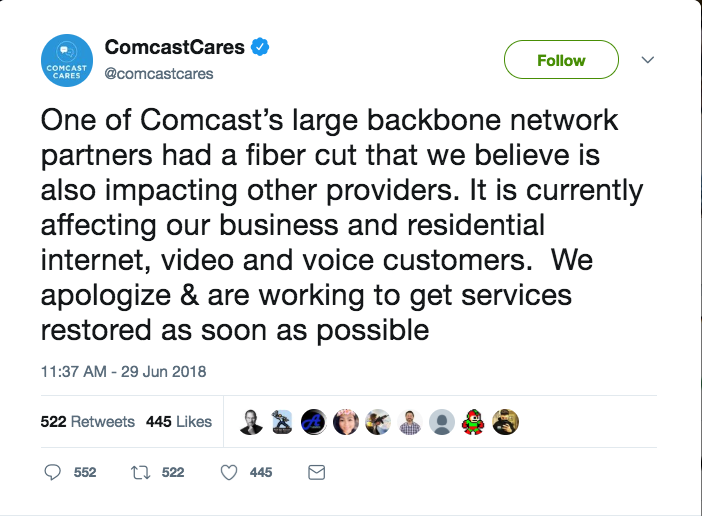
Later in the day, Comcast updated their statement to indicate two, separate and unrelated fiber cuts to network backbone providers, Level3 and Zayo, as reported by Wired.
Examining the data
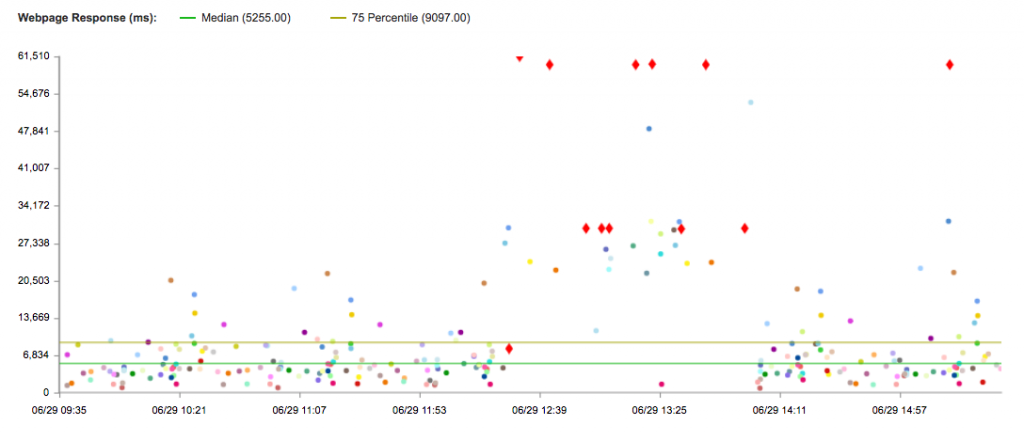
Catchpoint monitoring locations include nodes on the Comcast network. Looking at tests in our benchmark account run on Comcast nodes the earliest error we saw was at 12:27 Eastern Time.
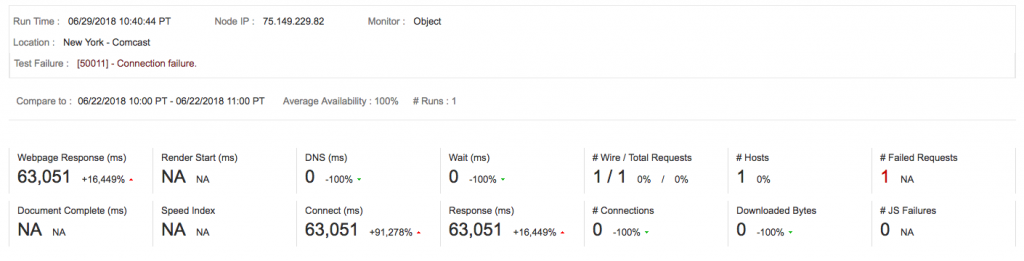
Many of the failures were due to connection failures and timeouts:
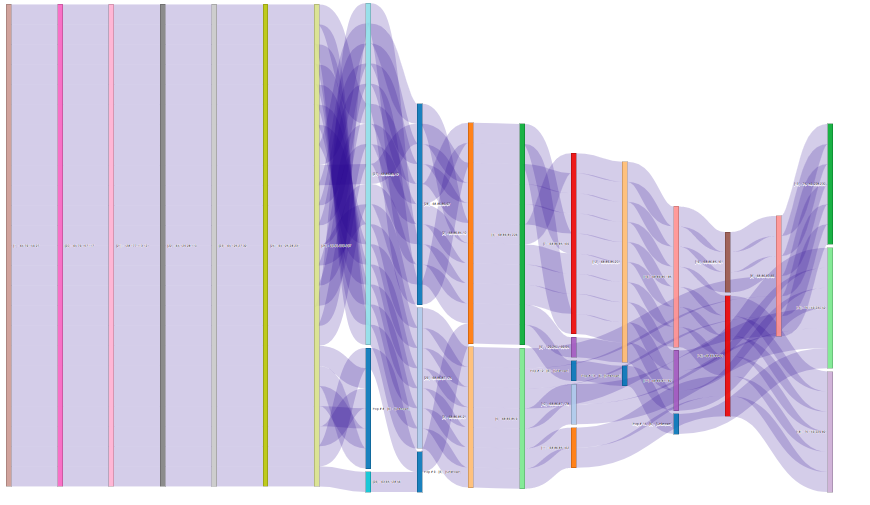
We also saw communication issues between our nodes and our command and control systems. One custom visualization we use when troubleshooting outages such as this is a Sankey diagram. A Sankey diagram helps to visualize the flow of data. The width of the arrows is proportional to the flow quantity.
When analyzing the traceroutes between our Comcast nodes in Chicago, Los Angeles, New York, Philadelphia, Seattle, San Francisco and Washington DC with a Sankey Diagram we see that the path analysis stops near Hop 8 and Hop 9 at the bottom of the chart. This indicates the point where the traceroutes dropped off in Comcast’s network.
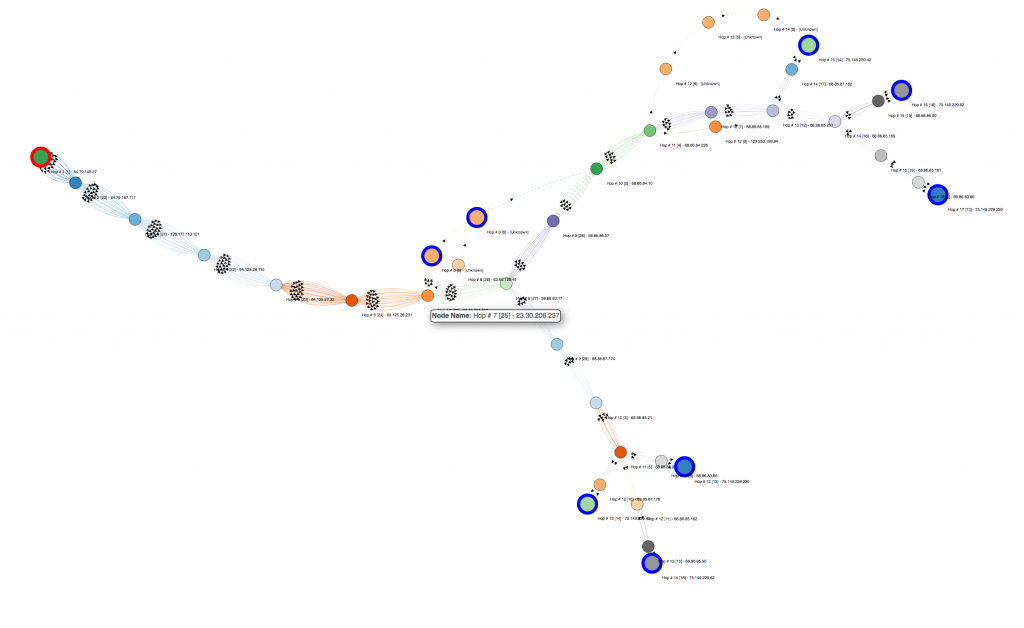
Another way to look at the same data is with a force directed visual. Force directed graphs use algorithms to try and determine how to display a network graph in a visually appealing way. Data is presented in a two-dimensional or three-dimensional way with all edges of equal length with minimal crossing edges.
The force directed visual of the traceroutes is displayed below. The blue circles show the termination point of traceroutes. These circles are typically on the right-hand side of the chart as that represents the end of the flow. The blue circles near the center show the traceroutes did not complete.
Impact of the outage
Outages like the one Comcast experienced can sometimes lead to other outages. One of the sites we use to confirm the impact of an outage is DownDetector.com. They collect passive user data from various sources.
The charts below show the widespread nature of the outage. This wasn’t localized to a single city or state. Customers across the US were affected.

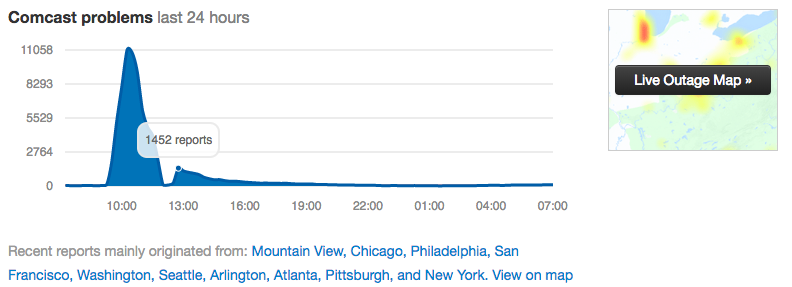
Many news articles about the outage referenced charts like these. As more people started searching for answers to the outage, Downdetector experienced a brief outage presumably due to the Slashdot effect.
What started out as a means of research, communication and collaboration has evolved. We have come to rely on the internet for day to day tasks. Remote employees, like me, rely on the internet to stay connected to co-workers. Small businesses rely on the internet to communicate with customers via e-mail, online chat, or VOIP phone services. Outages like these are seen as more than an inconvenience when they impact our lives and businesses in major ways. It is easy to get frustrated.
In times like these, we have to remember the internet is fragile. Outages will occur and given the interdependencies and complex nature of the internet, there can be a ripple effect when one service provider experiences an outage. As a consumer, there isn’t much you can do when outages occur. But as a business, you can monitor your application to identify when a vendor or provider is experiencing an issue.
_I would like to thank my colleagues Dhanush Suhas and Zachary Henderson for their help in gathering the data for this blog._
July 2, 2018


Dawn Parzych
This is some text inside of a div block.