Blog post
Blog Post
Benchmarking End User Experience with Web Vitals
Google created an initiative called Web Vitals that aims to define certain important metrics that should be considered for delivering a good end-user experience.
Most business verticals are now digitized. Consumers prefer online shopping, rather than going to a store. Within a few clicks, you can purchase any item of your choice and get it delivered to your doorstep.
One of the key reasons for online businesses gaining popularity is their time-saving nature. So, the main goal of any website should be to deliver the best end-user experience. This is something that has to be quantitatively measured through performance metrics, in order to identify areas of optimization and work towards improving the end-user experience.
How do we “measure” the end-user experience?
Right now, when it comes to measuring webpage performance there are several performance metrics to choose from. These range from how the content is downloaded, how the page is rendered to how the user interacts with the page itself.
Some of the key performance metrics are:
- First Contentful Paint (FCP): Measures the time taken by the browser to render the first bit of content from the DOM, such as an image, textual content, etc.
- Document Complete: The page processing is complete and all the resources on the page like images, fonts, etc have finished downloading. The onload event is fired.
- Total Time: Marks the total time taken to load and render all the elements on the page.
These are just some of the web performance metrics from the vast range available. Not all of these metrics are helpful in all cases. With the advent of complex webpage designs that include animations, dynamic content, and so on, it is difficult for web performance engineers to pick relevant metrics.
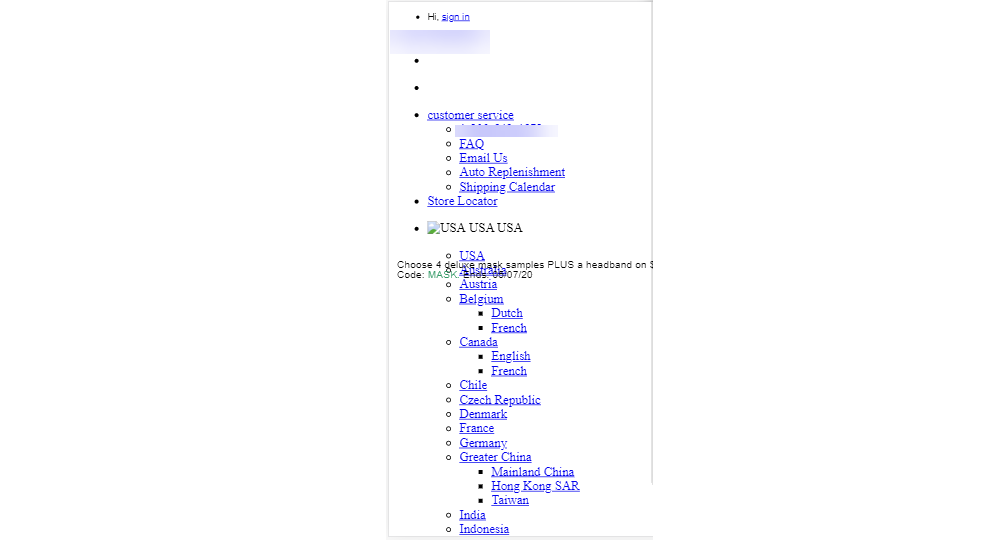
Fig 1. Page loaded without CSS and images.
In the above example [fig 1], the page HTML loaded and rendered, but the CSS and images have not. Users can interact with the links on the page but it does not count as a good user experience based on the metrics discussed earlier. The first contentful paint would not help, as it would only indicate when the text and link on the page rendered. Document complete may not have fired as the page content has not fully downloaded. The total time might be low, as fewer elements loaded.
These metrics do not necessarily give the right picture which makes it difficult to select the right metrics. Only someone who understands the webpage architecture fully will be able to select the right metrics that meet specific use cases.
To make this process simpler, Google has come up with an initiative called Web Vitals that aims to define certain important metrics that should be considered for delivering a good end-user experience.
Non-technical folks will find these metrics simple to understand. Site developers will also benefit as it is easier to identify critical areas of optimization.
The table below lists the 3 main aspects of user experience and the corresponding metrics used for measurement.
AspectMetricLoading contents in visual areaLargest Contentful Paint (LCP)InteractivityFirst Input Delay (FID)Visual stabilityCumulative Layout Shift (CLS)
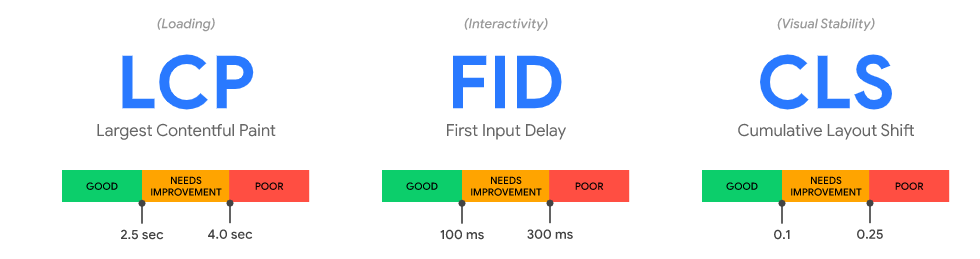
Fig 2. Web Vitals Metrics and Thresholds (source https://web.dev/vitals/)
Largest Contentful Paint (LCP)
LCP reports the time at which the largest above-the-fold content gets rendered on the page.
Why LCP when we have the FCP metric?
FCP captures the initially rendered content alone. One thing to note here is that web pages often load in stages, and as a result, it’s possible that the largest element on the page might change as seen in [Fig 3]. The LCP metric is designed to handle such changes.
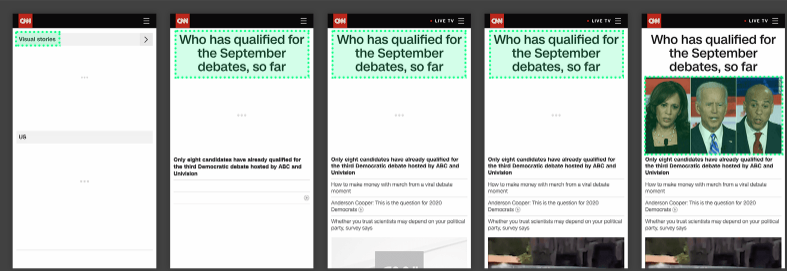
Fig 3. Largest Content on visual area changing, as the elements are being rendered
- According to Google, anything below 2.5 seconds is considered to be a “good” LCP time
First Input Delay (FID)
FID reports the time from when a user first interacts with a page to the time when the browser is actually able to respond to that interaction.
The end user gets frustrated when a webpage doesn’t load quickly, similarly, end users will also get frustrated if we give an illusion of interactivity while the page is still loading. If the user clicks or types (discrete actions) on the page and the site remain unresponsive, then this could potentially cause the user to leave the site or application.
Why the “delay”?
The latency occurs when the browser’s main thread is busy executing scripts, a large JavaScript for instance, and is unable to respond or interact with the user.
- According to Google, anything below 100ms is considered to be a “good” FID time
Note: FID doesn’t take into consideration actions such as zooming in or scrolling on the page as these are non-discrete continuous actions.
Cumulative Layout Shift (CLS)
CLS measures the sum total of all individual layout shift scores for every unexpected layout shift that occurs during the entire lifespan of the page.
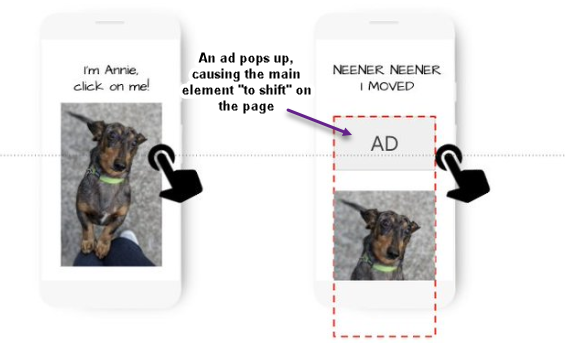
Fig 4. Layout Shift on a page
This again is a rather frustrating experience for the end user. CLS measures the instability of content by summing shift scores across layout shifts that don’t occur within 500ms of user input.
- According to Google, a score of 0.1 is considered to be a “good” CLS score.
Measuring Web Vitals using Catchpoint
Catchpoint’s RUM solution can be used to track these user experience metrics. The metrics can be measured easily using the web-vitals JavaScript library, which is a small production-ready wrapper around the underlying web APIs.
To implement, load the Web Vital JavaScript library in the head tag of the HTML page. This can be added before or after Catchpoint’s RUM tag.
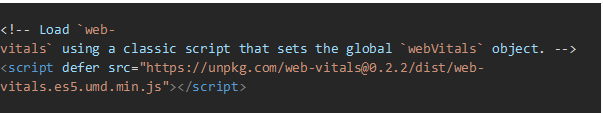
Place the code (in the image below) after the library in the head tag of the HTML page.
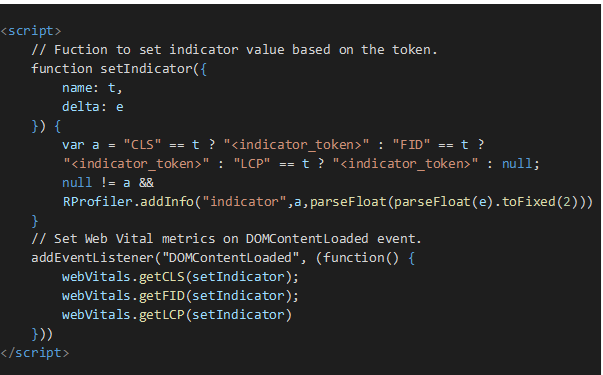
Once the web-vitals library is loaded and implemented on the page, it can be integrated with Catchpoint RUM to capture these custom metrics as indicators.
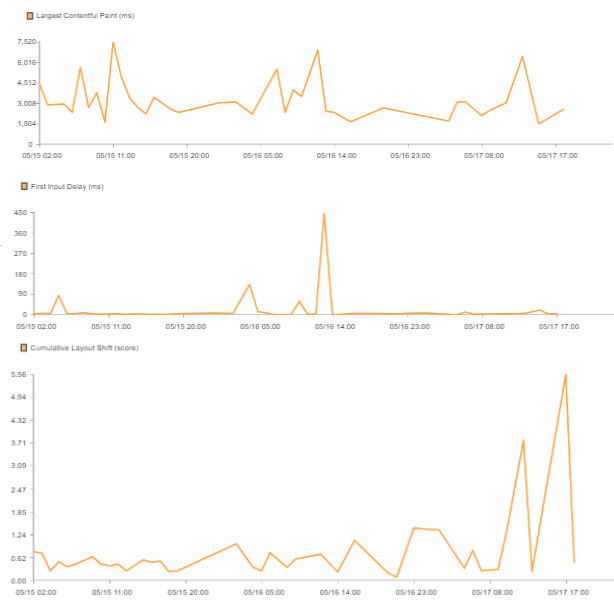
Fig 5. Web Vital Metrics in Catchpoint RUM solution
Correlate the data with business-related KPIs like bounce rate percentage
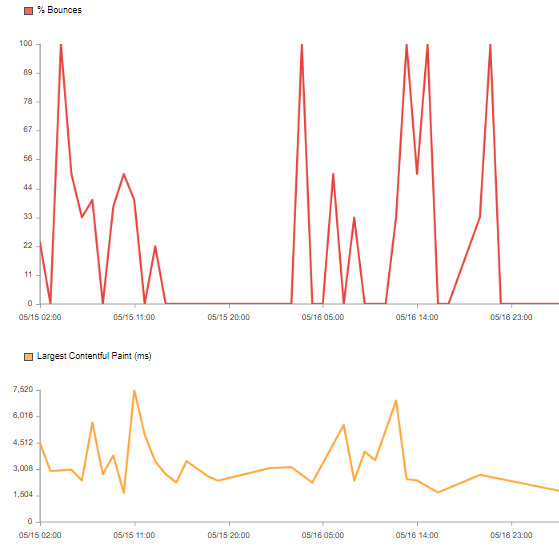
Fig 6. Impact of LCP on the bounce rate
These metrics are nothing but new methods of measuring applications in a way that matters to the end user which ultimately results in meeting the customers’ expectations. Different metrics provide different performance perspectives and the data from these metrics can play a crucial role in improving the end-user experience. You can easily set up and measure Web Vitals with Catchpoint’s Insight Feature to capture and track custom metrics.
This blog post was co-written by Loy Colaco and Megha Hanuman.
May 28, 2020


Megha Hanuman
This is some text inside of a div block.