Blog post
Blog Post
Maintaining Remote Employee Experience with SaaS Monitoring
We ran a global work from home day to gather insights into our employeesэ experiences in remote environments. Here we present our learning.
As a Senior Solution Engineer at Catchpoint, one of my primary roles is to meet face-to-face with SRE, DevOps, and IT professionals. I try to learn what challenges they face and to show how Catchpoint can help.
As a result, I am very accustomed to working from places outside the usual office environment, but that, however, is not the norm for the majority of my fellow 250 Catchpointers.
Given the recent trials that we are all going through around the coronavirus (COVID-19) outbreak, Catchpoint recently decided to run a ‘Work from Home’ day across the company as part of stress testing our business continuity plan. Catchpoint’s CEO detailed this plan in a LinkedIn blog.
As part of that program, we got some valuable employee experience feedback.

One of the biggest questions I had was about the performance of SaaS applications and services. As our employees’ transition to work from home, it’s hard to know the quality of their local IT infrastructure, etc. This is especially important since we’re a global business with employees working from all different corners of the globe!
What we can see is that there were some very big challenges around digital performance, specifically around audio/video quality. Around 17% of our employees reported audio/video issues.
Given my role in Solution Engineering, I want to understand the new normal of what my fellow employees experience as they work from home. I’d like to learn more about how Catchpoint can help answer the following questions for our customers.
- Are our major SaaS apps available at all times to all of our employees?
- Do consumer ISPs dramatically impact our employees’ digital experiences compared to the business ISPs that we won’t be leveraging?
- What application and services are being leveraged on a day-to-day basis as our employees work from home? Which ones aren’t?
- What kind of recommendations can our local Corporate IT (CIT) team make to our employees to guarantee a good experience? Do those recommendations work?
- Is this something we can support going forward for the unforeseeable future?
All our employee laptops run Catchpoint’s lightweight endpoint agent software that tracks the application performance and network reliability from wherever they are, resulting in some very useful (and might I add beautiful J ) data to look at.
For example, I can know right away the true end user availability and reachability around the globe of all the SaaS tools that Catchpoint employees leverage. I can see availability is about 99.88%.

Also, I have a direct view of granular user-centric performance KPIs such as HTTP response times, first paint times, first contentful paint times, visually complete times, and time to interactive measurements of all of the critical browser-based SaaS services that we leverage across the business.
A key thing to notice here is that the response times as reported from my fellow employee’s endpoints in India is noticeably higher (at about an additional 1 second) than that compared to our U.S. and EMEA employees, with full correlation to all synthetic traffic from that region as well.
Underneath all the location-specific performance data is the actual user’s traffic we’re analyzing to our critical SaaS services. When we look closer, we start to see that our apps like Sharepoint, Microsoft Teams, Box, and VersionOne can report greater response times compared to tools like ADP, Drift, or HubSpot.

But it’s important to take endpoint reported response times and normalize alongside the sample size for each. We can see that for the most part, our employees are primarily leveraging the Catchpoint portal and Salesforce far more than leveraging apps like ADP or Box.

Furthermore, we can see the city and browser details. For instance, I recently traveled back from our headquarters in NYC and stopped over briefly at a Starbucks in East Hartford, CT to check a few things in Salesforce before heading back to our Boston office. I ended up attending a meeting up on Massachusetts’s north shore and then had our work from home day in Woburn, MA. I can even see the performance improvement in my time to interactive measurement as I updated my Chrome version from 73 to 80 after I left the New York office!

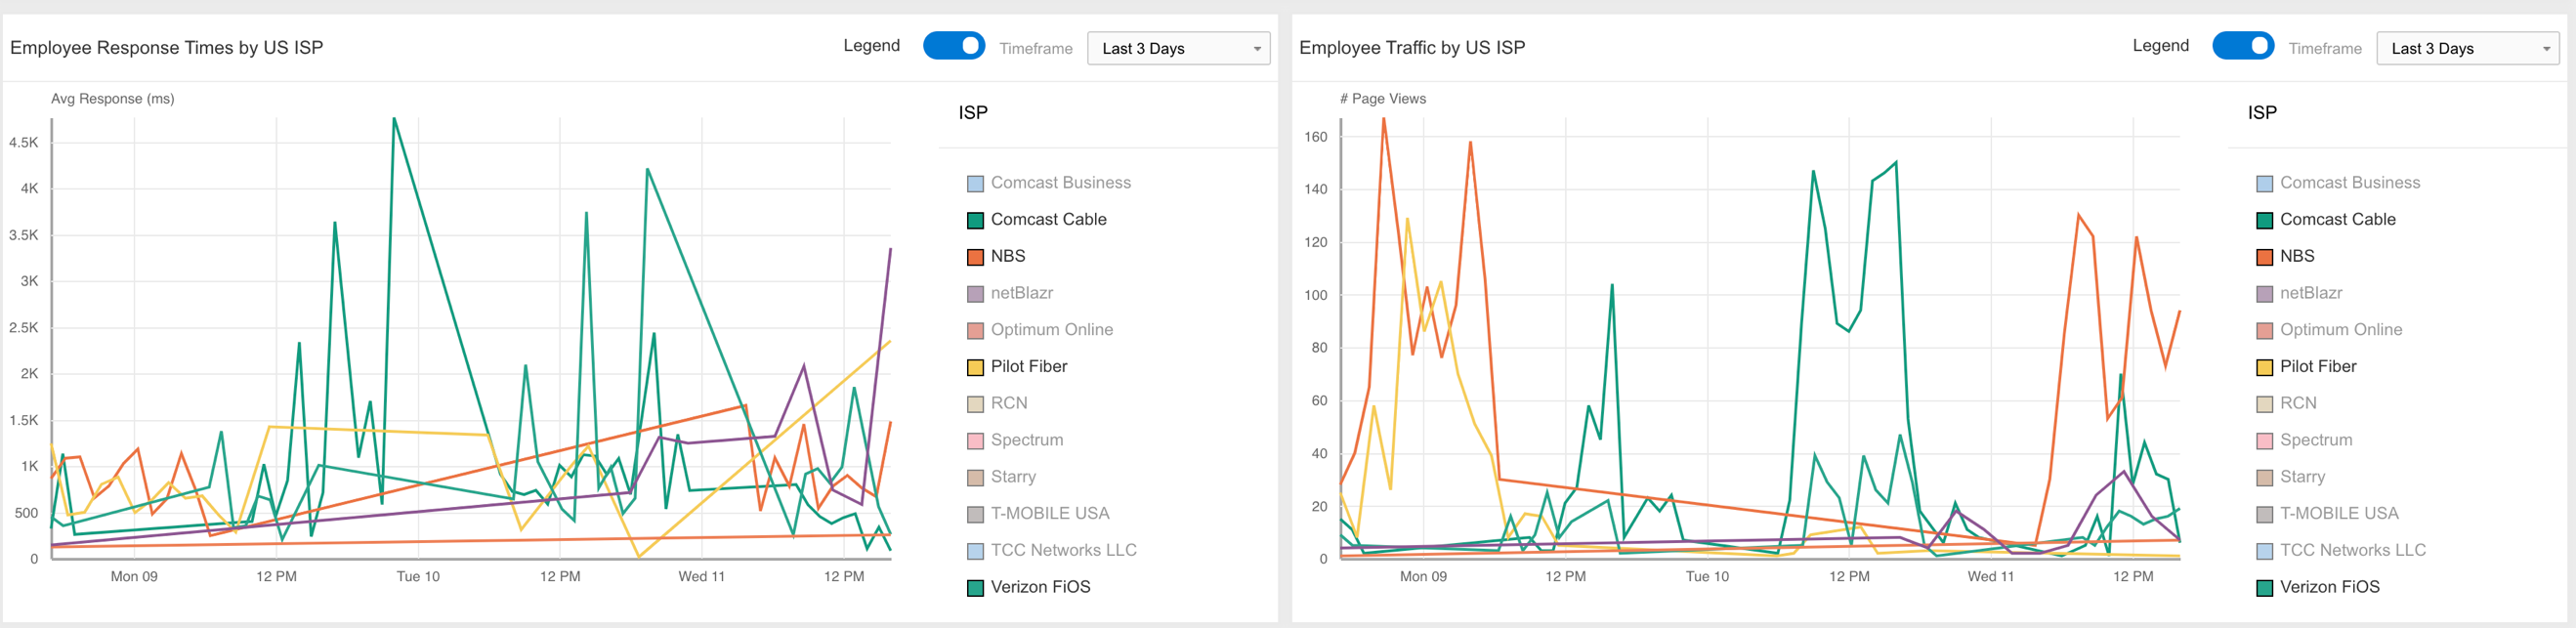
As Catchpoint ran this work-from-home day, our employees worked from a variety of different regions and on different networks. With the Catchpoint Endpoint agent, I can quickly study the performance of our employees’ home ISPs.
For instance, we can see as our U.S. employee traffic switch from our business ISPs, Pilot Fiber and NBS, in our New York and Boston offices, to more consumer ISPs such as Comcast and Verizon Fios.
However, we also start to see that average response times from Comcast can vary greatly, showing far less control over bandwidth and internet speed, which is a stark contrast to the consistent response times from Pilot Fiber and NBS.
Using this data, our CIT team can help recommend and diagnose any local network issues that can impact our employee’s ability to work, especially when they are using apps such as Zoom and Microsoft Teams that rely heavily on reliable network performance.
For example, as I was working from home in Woburn, MA I noticed some intermittent video and audio problems on some Zoom meetings throughout the day. I suspected it was network related as it never happened when working from the Boston or New York office.
Looking at the network traffic from my endpoint as I was working from home shows there were two network paths that I was taking–one where the initial hop round trip times directly from my endpoint was 17ms and the other was under 1ms!

I could see my Wi-Fi bouncing back and forth between my local router (192.168.1.1) and Comcast’s public XfinityWifi service (68.86.15.167) depending on where I was in my apartment. Realizing this, it was a simple process to ensure that my local wireless network (both the 2.4 and 5 GHz signals) was configured on my MacBook with the correct preference in mind.

This may not be apparent for a lot of my less technical colleagues, but I’m sure it helps out our CIT team greatly!
All the work that we’ve done here at Catchpoint over the years is making this sudden transition to working from home an easy one for us. Our investment in SaaS services makes it easy to access them anywhere and our end-to-end monitoring capabilities empower us to have complete visibility into how today’s internet impacts all Catchpointers’ day-to-day productivity. By having the right technologies, tools, and ‘employee and customer-centric’ processes in place, we can respond quickly with actionable insight into issues that impact any Catchpointers’ digital productivity. All Catchpointers can work confidently knowing that we are as prepared as possible to help them get through these challenging times and continue the award-winning support for all of our amazing customers.
Plus, for me personally, I now have a great story to tell my customers, prospects, and the amazing solution engineering team here about Catchpoint’s end-to-end employee experience monitoring capabilities.
If this type of visibility into your employee’s digital experience interests you, then I encourage you to check out our digital employee experience solution.
March 12, 2020


Zachary Henderson
This is some text inside of a div block.