Blog post
Blog Post
Get the Most Out of Performance Monitoring: Setting Alert Thresholds
In this article you will learn what is the best way to choose an alert threshold for analyzing the webpage response time.
A common question with our customers is, “What’s the best way to choose an alert threshold for analyzing my webpage response time?” It is a tricky question, and one whose answer varies case by case. Set the threshold too low and you’ll be distracted by – or worse, dismissive of – alerts as they fill up your inbox. But set it too high, and you might not know when some of your end users are having an unacceptably slow site experience. Choosing response time alerts is very much a balancing act.
To illustrate this point, let’s look at a case from an actual Catchpoint customer who recently went through the exercise of setting alert thresholds. First, they looked at their site’s average response times over the course of a week. A common practice is to take the average, add a little extra as a buffer, and presto alerts are set!
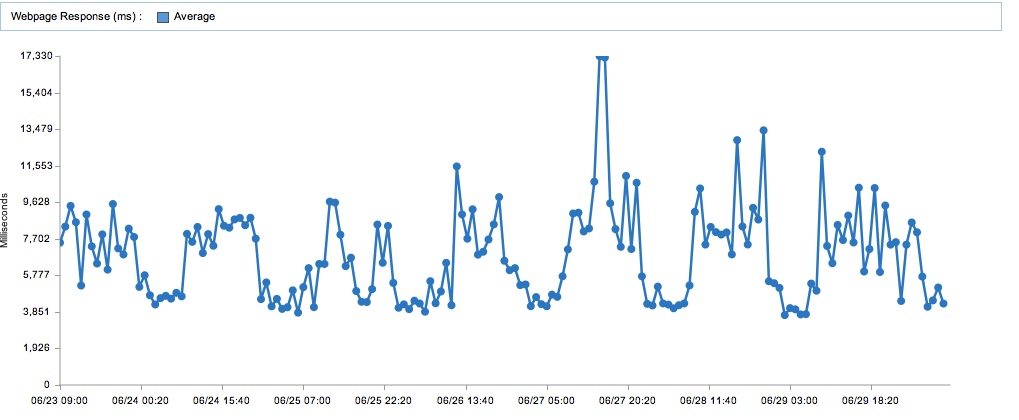
For this customer, the average (Chart 1) was a little under 7 seconds – 6,834 ms, to be exact. Adding a little buffer, they set the alert threshold at 11 seconds. Unfortunately – and unexpectedly – the 11-second threshold yielded about a gazillion alerts for our customer. So what happened?
The problem in this case has to do with variability of site usage and deviation from the mean. If you look carefully at Chart 1, you will see that the valleys occur during off business hours, and the peaks occur during the day. What the chart is not showing is that during business hours, there is significant variability in response time. Looking at Chart 2, a scatterplot of the values measured over the same period, you can see that the distribution of response times is far wider than Chart 1 would have you believe. In fact, the averages in Chart 1 never exceed 18,000 ms, whereas in Chart 2, we plainly see that there are dozens of instances of response times in excess of 20,000 ms.
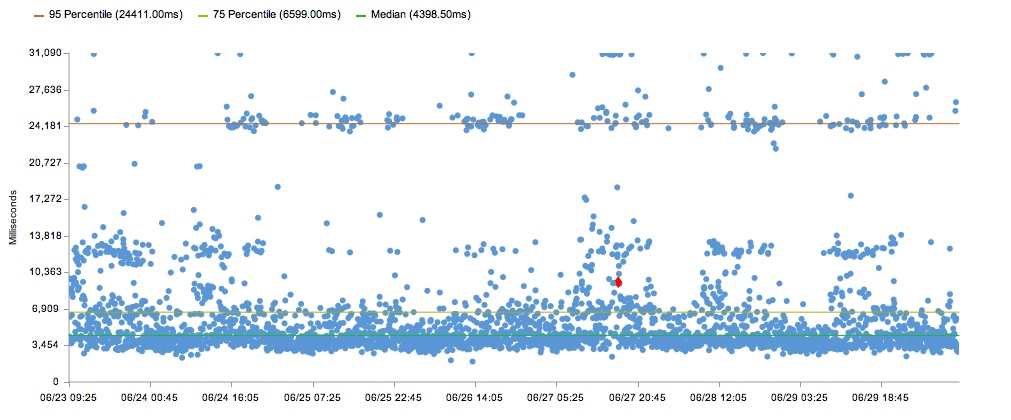
It’s obvious from Chart 2 that an 11 second alert threshold will trigger a lot of alerts. When you’re using simple average over a period time to set alerts, you’re ignoring the fact that the average is only an average. To set an alert you have to understand the data better and you need to dig deeper.
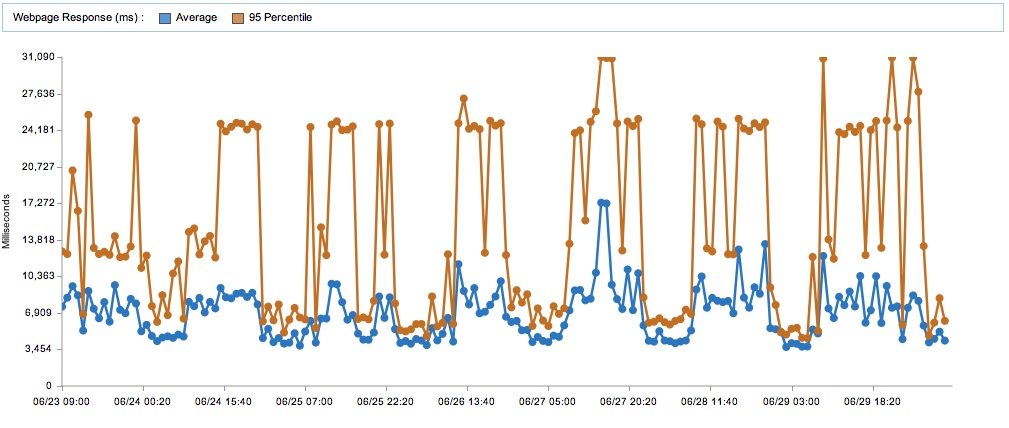
In Chart 3, we see the 95th percentile – meaning that 5% of the samples had response times as slow or slower. This is where you can look to get a better picture of a site’s performance at worst-case scenario. In the worst cases, the page is taking 24 seconds to load! So, what would you do? Would you set the alert level at 24,000 ms? 20,000 ms? 15,000 ms? It’s a balancing act.
An alternative to the 95% is to rely on moving average, which relies on a subset of data based on a time frame. Catchpoint alerts support the ability to specify a dynamic threshold based on the average of a previous set of time. For example alert if response is 50% above the last 15 minute average. This solution allows you to take into consideration recent data to determine if the application performance went down.
At the end of the day, it’s going to be a judgment call. Only you can decide what the proper level is for alert threshold, but we can tell you one thing for sure: you won’t find the answer by just looking at your averages.
The Catchpoint Team
Try Catchpoint Web Performance Solutions for free today!
July 4, 2011


Catchpoint Team
This is some text inside of a div block.