Blog post
Blog Post
Accelerate Observability with Catchpoint and Tanzu Observability
Gathering accurate monitoring data using different sets of tests and from multiple locations help provide clearer visibility into the system.
Web applications have evolved from static pages with minimal user interaction to a dynamic intuitive interface that delivers advanced functionality. the complex architecture of these applications makes it necessary to monitor and maintain application health, performance, and end-user experience. Catchpoint’s monitoring platform provides all the tools you need to track application performance. The platform allows you to monitor at the network level as well so you get the performance visibility into DNS providers, CDN vendors, cloud providers, and more. The true end-user experience can only be measured with a real browser. This gives more visibility in terms of how the application loads and renders; how different elements and third-party requests affect the application and how the user experience would be.
The Catchpoint integration with Tanzu Observability by Wavefront is a step towards advancing observability. “Observability is a measure of how well internal states of a system can be inferred from knowledge of its external outputs”. This Wikipedia definition captures the exact message Catchpoint provides with its end-user experience monitoring. With different synthetic test types available to use, the user experience can be measured from different environments (backbone, last mile, or other configuration nodes). Catchpoint captures a vast range of metrics to help understand and pinpoint performance issues. With this comprehensive information, we can better understand the state of a system at a given time. For example, if a user was not able to buy a product or services using a web application, with active monitoring we can narrow down to the root cause for that time frame.
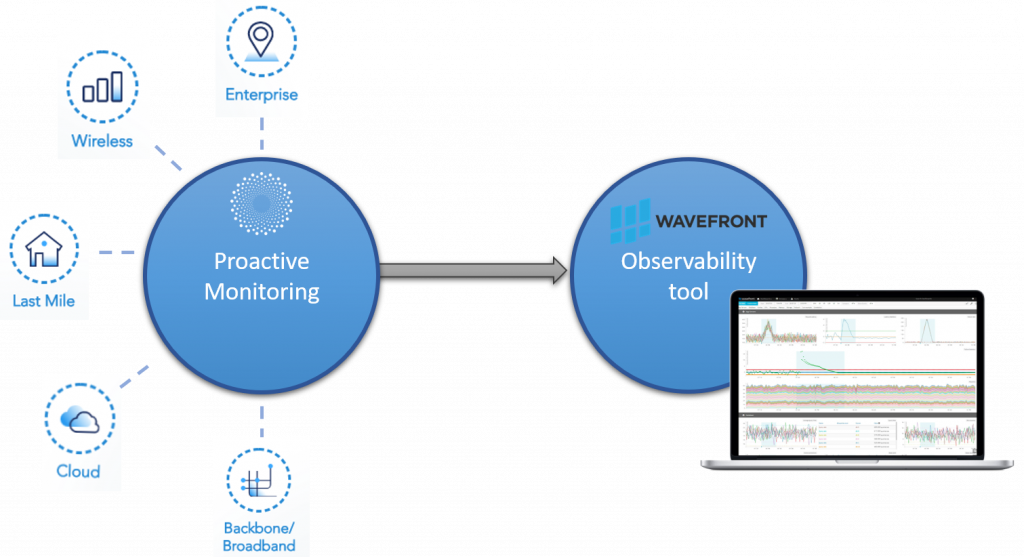
Fig 1. Combination of monitoring and observability tool.
There is a huge demand for observability teams and companies are investing in them and tools to help them meet their goal. The main goal of such a team is to check service level agreements (SLA) breaches or to check if service level objectives (SLO) are met and help make critical business decisions. The observability tools help to make better decisions based on data from multiple sources that is plotted together. An example of this is the CI/CD (continuous integration/continuous delivery) flow that uses Catchpoint end-user experience data.
Wavefront is a streaming analytics platform that supports observability. Wavefront lets you gauge the real-time impact of code release in a production environment. It can tell you how each sub-function affects the overall application. These metrics can be compared with the actual user performance data from Catchpoint to analyze and understand the impact even better.
Combining the Strengths of Catchpoint and Wavefront
Let us look at the individual strengths of each tool, Catchpoint and Wavefront, to get a better picture of how it works together:

This integration combines the strength of both tools and enhances observability with monitoring. The metrics collected in Catchpoint are sent to Wavefront to be consumed in different ways. Combining them with metrics from other tools provides complete visibility of the system.
Integrations Flow
This integration relies on Catchpoint’s Test Data Webhook to send JSON data to Wavefront. For this configuration to work we need to specify an endpoint where the JSON data will be sent. The setup is as follows:
- Configure Catchpoint “Test Data Webhook” to send default raw JSON data to an endpoint.
- Here, the Catchpoint data will be parsed and converted into a format that Wavefront supports. Once the data is converted into the desired format, it will be pushed to the Wavefront portal.
- To distinguish different users from each other, we need to set 2 header values while configuring Test Data Webhook.
- Wavefront-Cluster – this is specific to a user account (like a subdomain).
- Wavefront-Secret – API key for an account.
With this configuration, the user will be able to see the Catchpoint metrics in Wavefront. Please find the step by step set up guide here.
Analyzing End-User Experience with Wavefront
Wavefront provides a few out-of-the-box dashboards to use. These are specific to some of the popular test types in Catchpoint like DNS, Web, Ping, API, and FTP. The metrics from all these test types can be sent to Wavefront to build customizable dashboards as per the use case.
Here is an example of an out-of-the-box dashboard using Wavefront’s web test type.
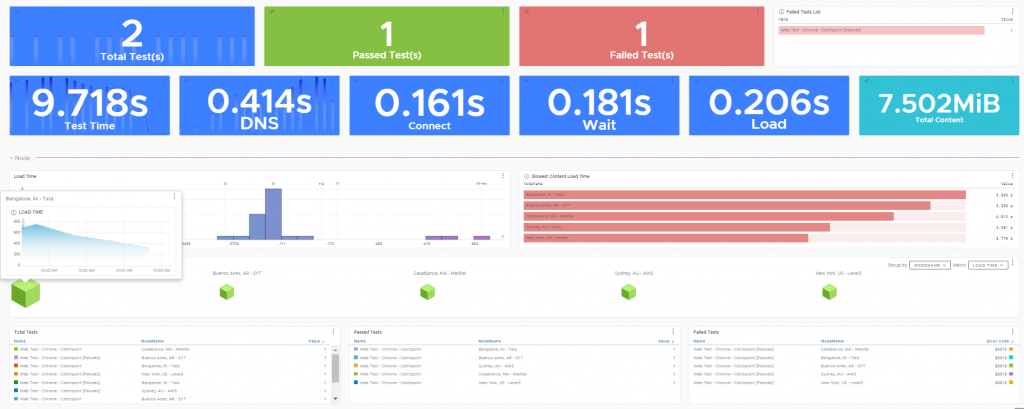
Fig 2. In-built web test dashboard – Overall performance and node level section.
This dashboard helps to view the health of multiple web tests in one place marking the number of passing tests and reporting the failures. The vital metrics that measure the end-user experience are highlighted at the top. The latter section showcases the performance across all locations that a resource is monitored from.

Fig 3. In-built web test dashboard – timing metrics section.
The timing metrics section (Fig 3) focuses on displaying how much time was spent loading resources. It plots the metrics over time making it easier to identify trends.
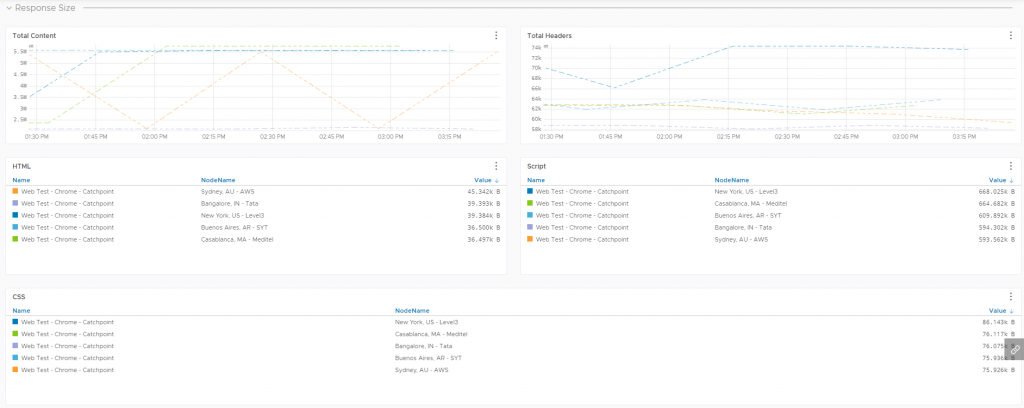
Fig 4. In -built web test dashboard – response content size section.
The final section in the dashboard (Fig 4) plots the amount of data downloaded when loading each resource. This highlights the amount of content and the headers download size over time. It also plots the different types of resources downloaded on the page and how many of these were downloaded from different locations.
Conclusion
Monitoring and observability complement each other. Gathering accurate monitoring data using different sets of tests and from multiple locations help provide clearer visibility into the system. Observability teams can make better decisions with this data and quickly determine the root cause when there is a need.
Integrating Catchpoint data with Wavefront can provide valuable insights. For example, consider the scenario when a new release is rolled out, you can analyze end-user experience to answer questions such as – did the performance stay stable? Did it degrade or improve when compared to before release?
June 17, 2020


Loy Colaco
This is some text inside of a div block.