Blog post
Blog Post
DEM with Catchpoint and Google Lighthouse (Part 1)
In the first part of this series we cover how monitoring tools has evolved along with technology.
Monitoring as an industry is going through a major shift. When the World Wide Web was still new, the systems which powered it were pretty simple. The systems were simple, and the users of the systems was limited. As a result, monitoring “Digital Experiences” did not even exist.
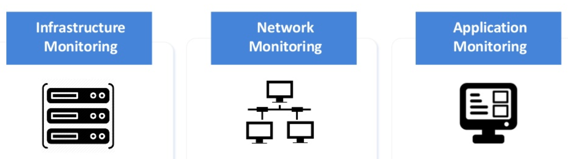
Traditional IT systems monitoring methodologies looked at Monitoring from a non-end user perspective and relied heavily on monitoring the individual components that made up the system; the focus was primarily on infrastructure, network, and application.
The assumption was that if all the components that made up the system were up and running, the system, as a whole, was available.
To re-iterate: monitoring how the end users were perceiving performance and their experience when accessing/interacting with an application was of little or no significance.
This methodology worked well as long as the systems were simple, and the components limited.
Fast forward to the current digital era – in today’s world, there are multiple layers which are invisible to end users, but crucial from a monitoring standpoint. Components such as Content Delivery Networks (CDNs), DNS (Managed), Cloud providers, and other third parties that integrate with your applications have now become important components in the delivery chain.

All these different components have made systems complex, pushing us to adopt monitoring models that not only take into consideration the individual siloed components, but also paint a complete picture that takes into consideration the most important factor: end-user experience.
The remarkable thing about this approach is that it drastically cuts down the time taken to detect/identify an issue as we are monitoring from the end user’s perspective. It focuses on the experience, checks if there was an aberration, and then drills down to pinpoint the exact root cause behind the deviation.
In today’s world, availability and reachability issues have been replaced with micro-outages, and because of the significant developments in the industry we work in, “slow is the new downtime.”
Now that we have understood how monitoring has evolved let us look at two amazing tools which were developed focusing on end-user monitoring: Catchpoint and Google Lighthouse.
The first part of this blog discusses each monitoring tool and how to use it. In the second part, we will discuss how the telemetry generated from these two systems complement each other and how it can be used to improve the experiences of end users.
Google Lighthouse
The first time I worked with Google Lighthouse was when I was trying to optimize the performance of my personal blog. I ran some audits using Chrome Dev tools and was blown away by the recommendations/opportunities that the tool provided.
For those who are not very familiar with Lighthouse, it is an open source project developed by the Google team to improve the performance and quality of web pages. It was developed primarily for the “developer community,” allowing them to run “audits” and generate “reports” against their web applications. The ultimate goal is to identify areas where they can leverage some of the best practices and look at recommendations generated by the tool to improve end-user experience, with a focus on the following aspects:
- Front-end Performance
- Progressive Web Apps
- Accessibility
- Best Practices
- SEO
Read more details about the tool here.
Catchpoint
The Catchpoint platform was developed with an ideology that at the end of the day, a monitoring solution is only useful when it tells you that your end users are having a problem. These problems can be segregated into four key pillars:
- Availability: When the application that your users are trying to interact with is not available.
- Reachability: Your systems are available, but your end users are unable to access it (ISP, CDN, DNS, or delivery chain component related issues).
- Performance: Everything is technically up, but the site or application is slow to load and causing frustration for end users.
- Reliability: A more long-term goal than the other three (and the trickiest to achieve), reliability is about delivering consistent availability, reachability, and performance over time.
Every digital experience that an end user has with your application matters and is very capable of impacting not just your brand value, but also your revenue. Poorly performing websites are ignored/shunned, and users are unlikely to return after a bad experience.
Lighthouse + Catchpoint
Setting up Lighthouse to create audits and generate reports is pretty straightforward if you are using Google Chrome. You can either run audits using Chrome Dev tools or make use of a browser extension to do the same.
Catchpoint also allows you to run Lighthouse reports as a custom monitor using our Enterprise Nodes. A Catchpoint Enterprise Agent is a solution that allows companies to perform Synthetic monitoring from locations within their organization. Companies typically deploy Enterprise Agents as physical or virtual appliances in their data centers, branch offices, call centers, or brick-and-mortar stores.
There are a lot of metrics, scores, and recommendations that get generated every time you run a lighthouse (LH) report, and there are multiple tools apart from Catchpoint that allow you to run these reports.
It is easy to generate a LH report and analyze the metrics, but before doing so, it is extremely important to identify the metrics which are important to you and your team. Once that is done, the next step is to focus on optimization efforts and monitor how these efforts are either resulting in performance gains or degradation.
In short, this is what the lifecycle looks like:

1. Identify metrics that matter: A metric fixation is never good! In many cases, I have seen people spend a lot of time identifying the metrics that are important to them. There is also this never-ending discussion around whether a single score or metric can be used to accurately represent the state of their applications, or whether one should go for a combination of metrics.
2. Continuous testing: As we all know by now, running a one-time Lighthouse report is simple. What is not so simple is to programmatically run these reports against multiple URLs, capture the metrics that are important to you, and trend those metrics over time. This is where Catchpoint becomes really powerful, as it allows you to capture these metrics from the Lighthouse reports allowing you to:
- Trend them over time
- Schedule reports
- Specify thresholds so that you get alerted every single time the reported number goes beyond the thresholds you have set
Let’s have a look at two screenshots below.
Below is a sample report which we generated using Chrome Dev Tools.

And the next screenshot is taken from Catchpoint where we are capturing the “Time to Interactive” as a metric after programatically running Lighthouse and capturing/trending the metric over time.

3. Optimize: Once you have the metrics identified, a trend which you can use to study the gains and losses, the next step is to focus on the optimization efforts that will improve the overall performance.
4. Track performance improvements/degradation: The fourth step in the constantly moving cycle is to track the performance improvements/degradation after the optimization efforts have been rolled out. In most the cases, this is a continuous cycle, which is exactly why Catchpoint comes into the picture and becomes a crucial tool to allow you to not just view the data, but translate it to actionable items.
Lighthouse + Catchpoint = Awesomeness
So far, we have discussed how monitoring has evolved along with technology. Monitoring tools were developed with an objective of solving different issues and challenges. The most important – like Catchpoint and Chrome Lighthouse – are powerful tools that complement each other. In Part 2, we discuss how you can combine Catchpoint and Lighthouse to improve end-user experience.
August 27, 2019


Nilabh Mishra
This is some text inside of a div block.