Blog post
Blog Post
Employee Experience – Monitoring the Metrics That Matter
In this blog, we look at some of the key indicators that have an impact on employee experience.
The shift to working remotely has made communication and collaboration tools, such as Zoom, Slack, and O365, an indispensable part of an employee’s workspace. Employees are no longer working within an office network where employee experience was reliable and more or less guaranteed. Instead, they are relying on their local ISP network to connect to everything and anything work-related and this has brought in a lot of vulnerabilities in an otherwise stable and secure workspace.
Employee experience has a direct impact on employee productivity which makes monitoring vital. Employee experience monitoring strategies had fewer variables and dependencies in the pre-COVID world when most employees shared the same network. Although the focus on maintaining SLAs and tracking SaaS availability remains, today, employee experience monitoring has moved beyond the office intranet and IT admins have had to redefine how they monitor and what needs to be monitored. In this blog, we look at some of the key indicators that have an impact on employee experience.
What should you monitor?
Working remotely entails several new challenges for IT admins – from ensuring every employee has access to the necessary tools to work, without compromising security, to detecting performance issues due to local ISP disruptions. Monitoring employee experience helps you identify:
- Applications that are not functioning
- Slow load times
- SaaS application availability
- Intranet applications that are down
- VOIP call quality
- Bottlenecks in the network or other network issues

These issues can have a major impact on employee productivity. Employees will not be able to work or complete projects if essential tools are not working. With the right employee experience monitoring strategy, you will be able to:
- Continually test critical applications and ensure services are always available, high performing, and reliable
- Maintain SLAs and have the data to hold your providers accountable
- Quickly identify root cause as fast as possible when things go wrong
To achieve these monitoring objectives, some of the important metrics to monitor include – Availability, Response times, Latency, and device-specific metrics such as CPU utilization and Memory Utilization.
Availability
When critical applications like Office 365, Salesforce, or Zoom are down or hit by performance degradation, you need a way to detect, identify and resolve the issue before it impacts employee productivity. Monitoring SaaS applications will provide visibility into the key performance indicators such as application availability. Proactively monitoring availability using synthetic tests allows you to simulate end-user transactions and this will help identify bottlenecks in the system that can then be quickly resolved based on the monitoring data.

In the image above, we see the performance of some of the major SaaS applications employees use daily. The 99.87% availability indicates that most users are able to access these applications without any issues. Keeping track of this metric can help reduce and eliminate performance issues which can disrupt employee productivity.
Response Time
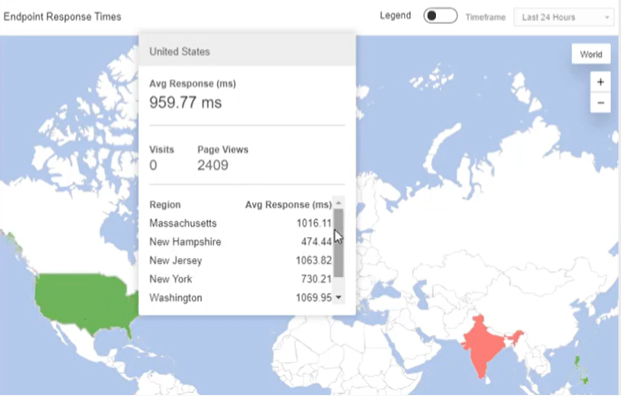
Another key performance indicator is the “Response Time” of these applications. It is the time taken by the application to respond with the basic HTML of the application. The metric can be used to compare the performance of different SaaS applications. The image below displays the response times for some of the popular SaaS tools, you can easily identify those that are performing well and those that have performance issues.

With employees working remotely from different locations, it also helps to break down the data by location and compare performance based on the employee location. For example, in the map below, users in India are facing higher response times for a specific application. The data can be further analyzed by the network type used by the employee so you can determine if the issue is caused by a specific ISP or if it is specific to the device used by the employee.
Latency (RTT)
Employees working remotely do not have access to hi-speed internet like they did in their offices, in addition to the limited bandwidth, there are multiple third-party services and components between the user and the application. You do not have insight into the networks and infrastructure (ISP, DNS, CDN) the employee is using outside the office environment. SD-WAN, VPN, firewall, and other network components are added layers that determine employee experience.
Consider a network architecture that implements SD-WAN. The network layer is complex as seen in the diagram below.

Such an architecture requires monitoring from the end-user perspective, in this case, an employee’s perspective. To understand the impact these different components have on employee experience, it is necessary to get an end-to-end visualization of network connectivity from the employee’s device to the server.
One of the metrics to focus on when measuring network performance is the latency or the total round trip time from the device to an application. Using a traceroute test, as illustrated below, you can proactively detect network-related issues that impact employee experience. The data helps identify where the latency is introduced in the application delivery chain. Each hop in the traceroute provides performance details that can use used to accurately diagnose network issues and to optimize network paths.

Device Specific Metrics
To understand true employee experience, you must also account for device-specific factors in addition to other performance indicators. The performance of the device the employee uses can also impact employee experience and productivity. It is necessary to track device metrics such as CPU and memory utilization to understand if the device is functioning optimally or if there are system processes/applications that are causing performance degradation.
CPU Utilization (%CPU)
In the color-coded chart below, we can compare CPU utilization data from multiple employee devices.

Memory Utilization (%RAM)
A similar chart compares the memory utilization on different employee devices.

Remote workers accessing applications through local ISPs and VPN, may face multiple performance issues that can quickly affect productivity. The IT team tasked with solving such problem need tools that can detect bottleneck outside the office infrastructure. These device-specific performance indicators make it easier for IT admins to isolate issues especially when the workforce has moved outside the office network.
Conclusion
IT admins are facing a unique challenge with the shift to remote work. Issues impacting employee productivity in a remote environment, with increased dependence on the Internet can introduce performance volatility and impact productivity. Monitoring a remote workforce is now an essential part of employee experience monitoring.
Catchpoint’s Endpoint Monitoring gives insight into all the key performance metrics that provide end-to-end visibility into employee experience. You can compare performance of specific applications. Map and correlate which devices are having poor employee experiences with which applications as illustrated in this data breakdown.

Employee experience monitoring, which combines application, network, and device monitoring, allows you to enforce SLAs, minimize downtime, and keep your employees productive.
Read more about monitoring employee experience in our handbook with detailed use cases for employee experience monitoring.
August 31, 2020


Kameerath Kareem
This is some text inside of a div block.