Blog post
Blog Post
Catchpoint Digital Monitoring: Offering lowest cost options without compromising quality
All digital experience monitoring platforms claim to achieve identical business results, but they may be limited in terms of how they achieve those results.
SaaS monitoring platforms must provide a flexible set of capabilities to their customers. A platform with the ability to adjust according to business needs reduces costs (e.g. the cost to switch) and tool sprawl since the need to perform different monitoring functions can be accommodated in a single place. A monitoring platform should allow you to adjust, for example:
- Data sources: businesses may be forced to accept a higher level of risk due to COVID and therefore might need to adjust their data sources to reduce costs;
- Data fidelity and granularity: the level of detail should be adjustable based on how a monitoring strategy might change over time;
- Proximity to the monitoring source: businesses may need to extend monitoring data to devices or real users to accommodate a distributed workforce or user base; and
- Monitoring frequency or sample rate: you may have to increase your frequency or sample rate when building a new service; you may then decrease your frequency or sample rate once the service is stable in production.
Not all digital experience monitoring platforms are the same. They may claim to achieve identical business results, but they may be limited in terms of how they achieve those results.
Given the need for flexibility, it is important to choose a platform (and not just a tool), which offers an array of capabilities, allowing for the ability to adjust for cost, time, risk, and uncertainty. An observability strategy, for example, might need to reduce costs. This would be an acceptable tactic if the overall result still sits in the value section of your value venn.

Since capabilities are the gateway to positive business outcomes, these ‘adjustable’ levers are examples of what to consider when choosing the correct digital experience monitoring platform.
Data Sources and Proximity
One may find themselves in a situation where they must reduce costs. In the context of digital experience monitoring, an example of accommodating this need would be to change your telemetry from backbone node monitoring to cloud node monitoring. There are drawbacks to this approach. Consider, for instance:
- Cloud node monitoring will reduce the surface area of the monitored end-user experience. This is because the telemetry is closer to the source (e.g. if you are hosted in the cloud while also monitoring from the cloud) and further from the end user perspective;
- Cloud node monitoring will limit the ability to detect reachability incidents; and
- Cloud node monitoring will introduce a false sense of security i.e. “a blind spot” element.
There is still realizable value to this approach when combined with other platform capabilities, though. If, for example, you are monitoring from multiple cloud providers, this “mesh” could still be used to troubleshoot and triage certain incidents if your monitoring platform has a multi-dimensional analytic capability, which lets you see performance on a cloud-by-cloud or region-by-region basis.
Another example of continued value would be to monitor from cloud nodes while retaining the same levels of frequency or granularity in your monitoring strategy. In this example, what we would lose in the ability to detect reachability incidents is offset by the ability to know whether your application or service is still available at the source.
With Catchpoint, you can manage cost by adjusting your monitoring data sources. Since Catchpoint is a platform and not just a tool, it offers the ability to adjust your data sources as your needs change.
Catchpoint data sources include:
- Backbone public nodes
- Last mile public nodes
- Public cloud nodes
- Wireless public nodes
- BGP peers
- Enterprise on your premise (office locations and datacenters)
- Employee devices (endpoint monitoring)
- Real user measurement (browser)
- Network (public nodes, enterprise nodes, endpoint agents)
- User sentiment (social media APIs)
Data Granularity
Businesses must have the ability to adjust the quantity and detail level of their monitoring data. For example, when a service is stable in production, the level of needed granularity may be different than when building a new service.
With Catchpoint, you can adjust the level of granularity and fidelity by precisely choosing whether to capture:
- base web metrics, such as DNS, Wait, or Load times
- host/domain level metrics for a host on a web page or application
- request-level metrics (e.g. if a host/domain services multiple requests)
- transaction/user journey metrics
- user-defined content grouping data (e.g. group all third-party ad content into its own bucket or group all CDN requests into their own bucket)
- data views to filter RUM data at the source to prevent them from affecting critical business analytics systems
- custom, user-defined KPIs for cases where standard web metrics are insufficient
Data Frequency or Sample Rate
Depending on your monitoring strategy and where you want to place in the value venn, consider adjusting your frequency or sample rate. If your strategy is to measure performance, then it is perfectly acceptable to monitor once every six minutes versus every five minutes. Alternatively, it could be acceptable to sample RUM at a rate of 70% versus 80%.
In this example, the concern over having a slightly smaller quantity of data would be offset by a powerful analysis ability to still unlock the stories within that data. Here, analytic visuals, such as frequency histograms or percentile functions would be extremely helpful because they capture the ‘long tail’.
With Catchpoint you can manage frequency or sample rate by precisely choosing:
- frequency (e.g. X amount of data in 1 minute, 2 minutes, 3 minutes, etc.)
- detail level (e.g. from individual web components, to full requests, to all server calls, to full page loads, to full user transactions or journeys)
- concurrency (e.g. running multiple monitors at the same time or spreading them out over an interval)
- application (e.g. settings for RUM to manage the percentage of data that gets sampled)
Data Quality of Experience
Businesses should never have to choose between high or low quality monitoring data. While the need to adjust data sources, frequency, or level of detail may vary from time to time, the need for ensuring a quality experience for both users and customers should never be an area of compromise.
With Catchpoint, you can manage the quality of experience by:
- trusting our fit-for-purpose-built stateless nodes to reduce false positives and increase signals;
- analyzing and correlating data directly in our user interface;
- using an API to feed into your Observability framework;
- increasing employee productivity by making alerts actionable;
- transforming customer experience by managing incidents before users are impacted;
- holding vendors accountable or reducing your own mean time to innocence;
- reducing operational toil allowing you to focus on high-value projects; and
- focusing on high-value activities as a result of augmenting your internal staff with Catchpoint’s professional services.
Success Factor: Choose a Platform with a Partner (Not a Tool from a Vendor)
It is much cheaper to establish a partnership with a platform like Catchpoint than it is to buy multiple tools from multiple vendors. A platform allows you to consolidate many different tools and gives the flexibility to use what is needed, only when it is needed. You may, for example, only need to perform networking monitoring when troubleshooting specific incidents, or you may only need to consider measuring third-party performance when choosing a new API vendor. As such, it is worth choosing a platform, which offers many capabilities that are adjustable to fit your needs as conditions change.
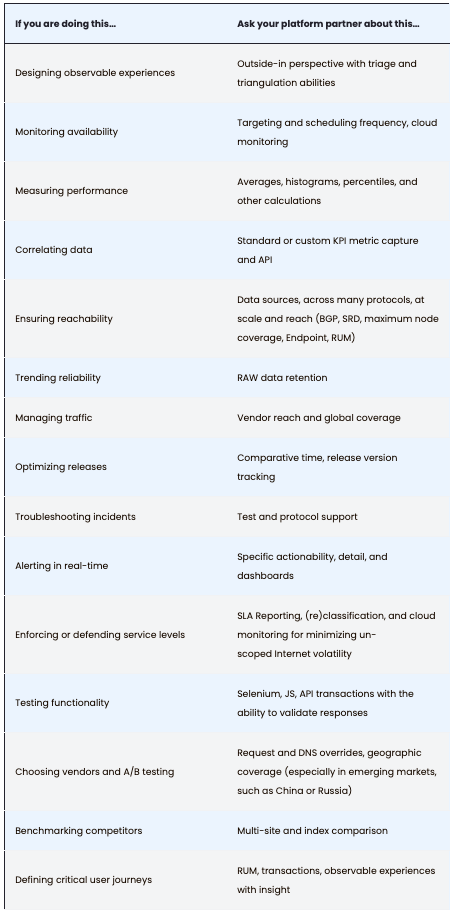
Regardless of whether business conditions change, the need to design observable experiences does not. It is a constant anchor around which to design strategies. Since observable experiences allow us to answer the question, “Is my customer or user experience the way it is because of the network, my code, the infrastructure, or a condition of the user themselves?”, it is critical to consider the following functional capabilities in the context of experience.
For an evaluation of your monitoring and observability strategy, please visit www.catchpoint.com to speak with one of our performance experts. While you are there, consider downloading our annual SRE report or listening to the key takeaways in this podcast.
July 31, 2020


Leo Vasiliou
This is some text inside of a div block.